How Ambari is upgraded to version 2.2.2.0 is described in Ambari Upgrade 1. The upgrade is not complete at this stage yet; a lot more is offered from the visualization perspective. Grafana is offered from Ambari 2.2.2. as a component of Ambari Metrics.
Apache Grafana is a visualization tool for time data series.
Hortonworks’ documentation on this can be obtained here.
Install Grafana
- Add the METRICS_GRAFANA component to Ambari
curl -u admin:admin -H "X-Requested-By:ambari" -i -X POST http://ambari-server:8080/api/v1/clusters/cluster_name/services/AMBARI_METRICS/components/METRICS_GRAFANA
If the command was a success the message HTTP/1.1 201 Created should appear.
- Add METRICS_GRAFANA to a host
curl -u admin:admin -H "X-Requested-By:ambari" -i -X POST -d '{"host_components":[{"HostRoles":{"component_name":"METRICS_GRAFANA"}}]}' http://ambari-server:8080/api/v1/clusters/cluster_name/hosts?Hosts/host_name=grafana-server-fqdnIf the command was a success the message HTTP/1.1 201 Created should appear.
If the message is HTTP/1.1 200 OK then something went wrong, perhaps the server where Grafana is going to be installed was not properly defined – use FQDN. - In Ambari Metrics, under Configs, under tab General Grafana Admin Password is missing.
 Enter a password and save the changes.
 - In Ambari, under Services -> Ambari Metrics you will see status on Grafana

- In Ambari, under Hosts -> grafana-server (or the name where Grafana resides), you find the Grafana component ready for install. Click on the Install Prending

- And click on Re-Install

- Install Status should be a success

Grafana Web UI should now be visible at the following address: grafana-server:3000. If everything went well, you should just refresh the website and see the Ambari Dashboards.
Signing in the Grafana gives extra options, among others also the Data Sources. AMBARI_METRICS is already added.
Manually configuring Data Source
Sign in.
Go to Grafana Web Ui and define an Ambari Metrics datasource
Data sources -> Add new
Under Url, type the grafana-server url address.
 Save and Test the connection.
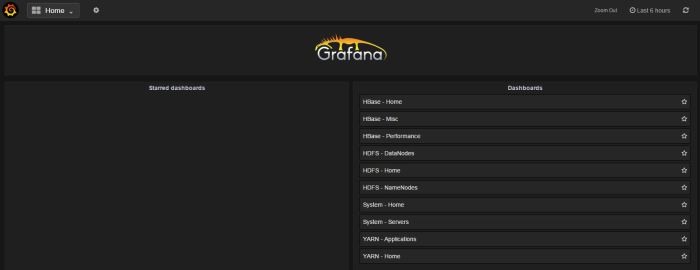
When you go in Grafana again, you should be able to see the list of default Ambari dashboards.