Hadoop Benchmark test – MRbench

The program runs small jobs a number of times and checks whether small jobs are responsive. It is a complementary benchmark test to Terasoft.

What this benchmark test does is it creates a folder MRBench on HDFS in /benchmarks and generates an input file in the input folder. This input file holds one string per line. After the input file is created, it is split into the output folders with amount of files matching the value of parameter reduces.
This job can be run many times, depending on parameter numRuns value. The parameters are explained further in the post.

The jar file needed for MRbench, in Hortonworks distribution, can be found under /usr/hdp/{hdp-version}/hadoop-mapreduce.

The cluster used for running tests for this post has HDP version 2.3.4.0-3485. One of my other clusters, running HDP 2.4, has version 2.4.0.0-169, for example.

Running the following jar file

yarn jar /usr/hdp/2.3.4.0-3485/hadoop-mapreduce/hadoop-mapreduce-client-jobclient-tests.jar mrbench --help

returns all the arguments available

MRBenchmark.0.0.2

Usage: mrbench [-baseDir <base DFS path for output/input, default is /benchmarks/MRBench>]
[-jar <local path to job jar file containing Mapper and Reducer implementations, default is current jar file>]
[-numRuns <number of times to run the job, default is 1>]
[-maps <number of maps for each run, default is 2>]
[-reduces <number of reduces for each run, default is 1>]
[-inputLines <number of input lines to generate, default is 1>]
[-inputType <type of input to generate, one of ascending (default), descending, random>]
[-verbose]

reduces defines number of reduce jobs which is also seen in number of output files (input data is split into number of files equal to reduces value).

numRuns defines number of times the test is going to be run. Each job starts with the following info:

INFO mapred.MRBench: Running job 0

The counter starts at 0 and ends with numRuns – 1.

inputLines defines number of lines generated. These lines hold one number per line. If inputLines is 100, numbers from 000 to 099 are generated. In what order are they generated is defined by inputType.

inputType defines sort order of the numbers generated.

For example, if we define inputLines to be 1000 and inputType ascending (default), this will generate numbers from 0000 to 0999 in the input file, one value per line.
Value descending for inputType is going to sort them from 0999 to 0000 in the input file.
Value random is going to generate random numbers with no sorting. And trust me, they will be random.
Example:

6493553352002875669
-6076474133462114203
-4219424128611728137
3147428516996533652
8833283876026349807
-6231574853220588520
4464414501313572651
4107251190398906611
7209395140850842640
-8963297226854656877

The program can be run with no attributes as well, as Test 1 shows.

Test 1: No arguments

The default values of the arguments are the following:

Argument Default value
numRuns 1
maps 2
reduces 1
inputLines 1
inputType ascending
yarn jar /usr/hdp/2.3.4.0-3485/hadoop-mapreduce/hadoop-mapreduce-client-jobclient-tests.jar mrbench

Output (with my comments):

/*arguments maps and reduces*/
Job Counters
                Launched map tasks=2
                Launched reduce tasks=1

/*arguments inputLines, maps and reduces, and average time*/
DataLines       Maps    Reduces AvgTime (milliseconds)
1               2       1       28846

Average time to finish the job was almost 29 seconds.

Test 2: 10 runs, default values

yarn jar /usr/hdp/2.3.4.0-3485/hadoop-mapreduce/hadoop-mapreduce-client-jobclient-tests.jar mrbench -numRuns 10

Output (with my comments):

/*numRuns is 10, the job is run 10 times, each job starts with a counter. Example of job number to here. */
16/06/21 13:06:42 INFO mapred.MRBench: Running job 1
DataLines       Maps    Reduces AvgTime (milliseconds)
1               2       1       20986

Average time per job was almost 21 seconds.

Test with results

Here is an example of one benchmark test.

yarn jar /usr/hdp/2.3.4.0-3485/hadoop-mapreduce/hadoop-mapreduce-client-jobclient-tests.jar mrbench -numRuns 2 -maps 50 -reduces 10 -inputLines 100000000 -inputType random

Some results from running this test on one of my clusters.

Input parameters Output statistics
inputLines maps reduces numRuns inputType Input file size generated Avg time
1.000.000 10 5 2 asc/desc 7.4MB 26s
1.000.000 10 5 2 random 19.4MB 28s
10.000.000 10 5 2 asc/desc 85.8MB 36s
10.000.000 10 5 2 random 194.4MB 35s
100.000.000 10 5 2 asc/desc 256MB 97s
100.000.000 10 5 2 random 1.9GB 100s
100.000.000 50 10 2 random 1.9GB 78s


For measuring I/O (read/write) performance, check the post about TestDFSIO.

Adding Hive, Tez & Pig in Ambari

I have 4 Hadoop environments, all running distribution Hortonworks, versions are either 2.3.4 or 2.4. I have installed HDFS, MapReduce and YARN first and the need is to add Hive.

When installing Hive, Pig and Tez follow with it whether you want it or not.

I already have an existing MySql database (because of Ranger) and this post describes how to install Hive and use an existing MySql for metastore. Installing Hive with a new MySql is actually easier.

  1. On Ambari server, from the CLI, run the following
    sudo ambari-server setup --jdbc-db=mysql --jdbc-driver=/usr/share/java/mysql-connector-java.jar
    

    Output:

    Using python  /usr/bin/python
    Setup ambari-server
    Copying /usr/share/java/mysql-connector-java.jar to /var/lib/ambari-server/resources
    JDBC driver was successfully initialized.
    Ambari Server ‘setup’ completed successfully.

  2. Log in to Ambari as administrator
  3. From the Actions drop down menu on the left side of the screen, click Add Service
    flume-add service
  4. Choose services
    Check services Tez, Hive and Pig. If you pick only Hive, the installation wizard will remind you that you have to set up Tez and Pig packages as well.
    choose services
  5. Assign masters
    In this case, I am installing Hive on my namenode. This can always be changed – it is possible to move services to other instances (why do you think my namenode is called md-namenode2? ;))
    assign masters
  6. Assign Slaves and Clients
    Tez Client, HCat Client, Hive Client and Pig Client are going to be installed to this host(s).
    In this case I am installing it on the same server as Hive server, on “more serious” clusters I install the clients where they belong – the client server.
    assign slaves
  7. Customize Services
    On the MySql Server used for Hive metastore run the following commands as root

    CREATE USER 'hive'@'localhost' IDENTIFIED BY 'hive';
    CREATE USER 'hive'@'%' IDENTIFIED BY 'hive';
    FLUSH PRIVILEGES;


  8. Set up connection string to the metastore
    Choose “Existing MySQL Database”hive metastore setup

    Note: If there is a problem connecting to the database when testing the connection, check also in the my.cnf on the MySql server if the following property is uncommented:

    bind-address           = 127.0.0.1

    Comment it (# in front of the line), since we are connecting to the server from other hosts than localhost.

  9. Review
    review
    If the installation details are acceptable, proceed with the installation.
  10. When the installation is complete. The installed services are now available
    service available
    Do not forget to restart the services if Ambari suggests so!

Error during installation

resource_management.core.exceptions.Fail: Applying Directory[‘/usr/hdp/2.4.0.0-169/tez/conf’] failed, looped symbolic links found while resolving /etc/tez/conf

The solution to it run the following on the Hive server (md-namenode2 in this example):

unlink /etc/tez/conf

Hadoop Benchmark test – TestDFSIO

Preparing the environment

Create a folder where the benchmark result files are saved:

sudo -u hdfs mkdir /home/hdfs/benchmark

Give access to everyone (if more users would like to run benchmark tests, otherwise skipp this and run the commands as hdfs user) :

sudo -u hdfs chmod 777 /home/hdfs/benchmark


About TestDFSIO benchmark test

Program TestDFSIO can be found in jar file /usr/hdp/2.3.4.0-3485/hadoop-mapreduce/hadoop-mapreduce-client-jobclient-tests.jar.

The TestDFSIO benchmark is used for measuring I/O (read/write) performance. It does this by using a MapReduce job to read and write files in parallel. Hence, functional MapReduce is needed for it.

The benchmark test uses one map task per file.

By invoking the benchmark with no arguments

yarn jar /usr/hdp/2.3.4.0-3485/hadoop-mapreduce/hadoop-mapreduce-client-jobclient-tests.jar TestDFSIO

usage instructions are shown:

Missing arguments.

Usage: TestDFSIO [genericOptions] -read [-random | -backward | -skip [-skipSize Size]] | -write | -append | -truncate | -clean [-compression codecClassName] [-nrFiles N] [-size Size[B|KB|MB|GB|TB]] [-resFile resultFileName] [-bufferSize Bytes] [-rootDir]


Arguments

Defining result file (-resFile)

By using argument -resFile, the file location and name are defined for the results of the tests.

Example:

-resFile /home/hdfs/benchmark/TestDFSIOwrite

If this argument is not given, the result file is written in current directory under the name TestDFSIO_results.log.

If the argument is pointing to an existing file, the result is appended to it. Here follows an example of a result file after 2 tests have been run:

—– TestDFSIO —– : write
Date & time: Sun Jun 19 17:39:20 CEST 2016
Number of files: 10
Total MBytes processed: 100.0
Throughput mb/sec: 17.13796058269066
Average IO rate mb/sec: 17.385766983032227
IO rate std deviation: 2.1966324914130517
Test exec time sec: 30.607

—– TestDFSIO —– : write
Date & time: Sun Jun 19 17:47:23 CEST 2016
Number of files: 10
Total MBytes processed: 100.0
Throughput mb/sec: 15.332720024532351
Average IO rate mb/sec: 16.875974655151367
IO rate std deviation: 3.72817574426085
Test exec time sec: 25.766

Write test (-write)

By using argument –write, we tell the program to test writing to the cluster. It is convenient to use this before the –read argument, so that some files are prepared for read test.

The written files are located in HDFS under folder /benchmarks, in folder TestDFSIO. If the write test is run and the TestDFSIO folder is already there, it will be first deleted.

Read test (-read)

By using argument –read, we tell the program to test read from the cluster. It is convenient to run test with argument –write first, so that some files are prepared for read test.

If the test is run with this argument before it is run with argument write, an error message like this show up:

16/06/20 11:21:32 INFO mapreduce.Job: Task Id : attempt_1463992963604_0028_m_000005_0, Status : FAILED Error: java.io.FileNotFoundException: File does not exist: /benchmarks/TestDFSIO/io_data/test_io_5

Number of files (-nrFiles)

The argument defines the amount of files used in test. If the test is writing, this argument defines the amount of output files. If the test is reading, this argument defines the amount of input files.

File size (-size)

The argument defines the size of file(s) used in testing. This argument takes a numerical value with optional B|KB|MB|GB|TB. MB is default.

Remove previous test data (-clean)

The argument deletes the output directory /benchmarks/TestDFSIO in HDFS.

Command:

sudo -u hdfs yarn jar /usr/hdp/2.3.4.0-3485/hadoop-mapreduce/hadoop-mapreduce-client-jobclient-tests.jar TestDFSIO -clean

Example of an output:

INFO fs.TestDFSIO: TestDFSIO.1.8
16/06/20 11:16:54 INFO fs.TestDFSIO: nrFiles = 1
16/06/20 11:16:54 INFO fs.TestDFSIO: nrBytes (MB) = 1.0
16/06/20 11:16:54 INFO fs.TestDFSIO: bufferSize = 1000000
16/06/20 11:16:54 INFO fs.TestDFSIO: baseDir = /benchmarks/TestDFSIO
16/06/20 11:16:55 INFO fs.TestDFSIO: Cleaning up test files


TestDFSIO tests

Test 1: write 10 files, size 10MB

Write 10 files, each with a size 10MB and put the results in /home/hdfs/benchmark/TestDFSIOwrite.

yarn jar /usr/hdp/2.3.4.0-3485/hadoop-mapreduce/hadoop-mapreduce-client-jobclient-tests.jar TestDFSIO -write -nrFiles 10 -size 10MB -resFile /home/hdfs/benchmark/TestDFSIOwrite

Result:

—– TestDFSIO —– : write
Date & time: Sun Jun 19 17:39:20 CEST 2016
Number of files: 10
Total MBytes processed: 100.0
Throughput mb/sec: 17.13796058269066
Average IO rate mb/sec: 17.385766983032227
IO rate std deviation: 2.1966324914130517
Test exec time sec: 30.607

Test 2: read 10 files, size 10MB

yarn jar /usr/hdp/2.3.4.0-3485/hadoop-mapreduce/hadoop-mapreduce-client-jobclient-tests.jar TestDFSIO -read -nrFiles 10 -size 10MB -resFile /home/hdfs/benchmark/TestDFSIO

Result:

—– TestDFSIO —– : read
Date & time: Mon Jun 20 10:49:24 CEST 2016
Number of files: 10
Total MBytes processed: 100.0
Throughput mb/sec: 68.87052341597796
Average IO rate mb/sec: 170.9973602294922
IO rate std deviation: 135.61526628958586
Test exec time sec: 39.793

Test 3: write 50 files, size 100MB

yarn jar /usr/hdp/2.3.4.0-3485/hadoop-mapreduce/hadoop-mapreduce-client-jobclient-tests.jar TestDFSIO -write -nrFiles 50 -size 100MB -resFile /home/hdfs/benchmark/TestDFSIO

Result:

—– TestDFSIO —– : write
Date & time: Mon Jun 20 13:22:00 CEST 2016
Number of files: 50
Total MBytes processed: 5000.0
Throughput mb/sec: 3.393228337799953
Average IO rate mb/sec: 4.491838455200195
IO rate std deviation: 3.903713550708894
Test exec time sec: 65.042

Running the following command on one file written in the benchmark test:

hdfs fsck /benchmarks/TestDFSIO/io_data/test_io_0

Returns (selection):

Average block replication: 3.0
Number of data-nodes: 4

Test 4: write 50 files, size 100MB, replication factor 2

Cluster’s default replication factor is 3. In this case, we run the test with argument –D and change the replication factor to 2.

yarn jar /usr/hdp/2.3.4.0-3485/hadoop-mapreduce/hadoop-mapreduce-client-jobclient-tests.jar TestDFSIO -D dfs.replication=2 -write -nrFiles 50 -size 100MB -resFile /home/hdfs/benchmark/TestDFSIO

Result:

—– TestDFSIO —– : write
Date & time: Mon Jun 20 13:39:17 CEST 2016
Number of files: 50
Total MBytes processed: 5000.0
Throughput mb/sec: 8.495729196932702
Average IO rate mb/sec: 11.038678169250488
IO rate std deviation: 8.691344876093968
Test exec time sec: 43.378

Running the following command on one file written in the benchmark test:

hdfs fsck /benchmarks/TestDFSIO/io_data/test_io_0

Returns (selection):

Average block replication:     2.0
Number of data-nodes:          4

Test 5: write 50 files, size 1GB, time

time yarn jar /usr/hdp/2.3.4.0-3485/hadoop-mapreduce/hadoop-mapreduce-client-jobclient-tests.jar TestDFSIO -write -nrFiles 50 -size 1GB -resFile /home/hdfs/benchmark/TestDFSIO

Result:
—– TestDFSIO —– : write
Date & time: Mon Jun 20 16:59:56 CEST 2016
Number of files: 50
Total MBytes processed: 51200.0
Throughput mb/sec: 3.3432171543606457
Average IO rate mb/sec: 3.805697441101074
IO rate std deviation: 1.8925752533465978
Test exec time sec: 421.994

Output (time):

real 7m11.604s
user 0m21.056s
sys 0m2.757s

Where the relevant metrics is real.
In some cases, running time is not needed, since the execution time is in the test report or output.

MRbench test benchmarks how responsive small jobs are in a cluster can be.


Ambari Upgrade 2: Install Grafana

How Ambari is upgraded to version 2.2.2.0 is described in Ambari Upgrade 1. The upgrade is not complete at this stage yet; a lot more is offered from the visualization perspective. Grafana is offered from Ambari 2.2.2. as a component of Ambari Metrics.

Apache Grafana is a visualization tool for time data series.

Hortonworks’ documentation on this can be obtained here.

Install Grafana

  1. Add the METRICS_GRAFANA component to Ambari
    curl -u admin:admin -H "X-Requested-By:ambari" -i -X POST http://ambari-server:8080/api/v1/clusters/cluster_name/services/AMBARI_METRICS/components/METRICS_GRAFANA

    If the command was a success the message HTTP/1.1 201 Created should appear.

  2. Add METRICS_GRAFANA to a host
    curl -u admin:admin -H "X-Requested-By:ambari" -i -X POST -d '{"host_components":[{"HostRoles":{"component_name":"METRICS_GRAFANA"}}]}' http://ambari-server:8080/api/v1/clusters/cluster_name/hosts?Hosts/host_name=grafana-server-fqdn
    

    If the command was a success the message HTTP/1.1 201 Created should appear.
    If the message is HTTP/1.1 200 OK then something went wrong, perhaps the server where Grafana is going to be installed was not properly defined – use FQDN.

  3. In Ambari Metrics, under Configs, under tab General Grafana Admin Password is missing.
    ambari grafana config uname passwordEnter a password and save the changes.
  4. In Ambari, under Services -> Ambari Metrics you will see status on Grafana
    ambari grafana status
  5. In Ambari, under Hosts -> grafana-server (or the name where Grafana resides), you find the Grafana component ready for install. Click on the Install Prending
    grafana install pending
  6. And click on Re-Install
    grafana reinstall
  7. Install Status should be a success
    grafana install status success
    Grafana Web UI should now be visible at the following address: grafana-server:3000. If everything went well, you should just refresh the website and see the Ambari Dashboards.
    Signing in the Grafana gives extra options, among others also the Data Sources. AMBARI_METRICS is already added.


Manually configuring Data Source

Sign in.
Go to Grafana Web Ui and define an Ambari Metrics datasource
Data sources -> Add new
Under Url, type the grafana-server url address.
grafana define datasourceSave and Test the connection.

When you go in Grafana again, you should be able to see the list of default Ambari dashboards.

Grafana


Apache Zeppelin – Interpreter configuration

In earlier posts, I describe how to build and configure Zeppelin 0.6.0 and Zeppelin-With-R. Here is how the interpreters are configured.

The following interpreters are mentioned in this post:

  • Spark
  • Hive

Spark interpreter configuration in this post has been tested and works on the following Apache Spark versions:

  • 1.5.0
  • 1.5.2
  • 1.6.0


Basic Spark

Once the page loads, click on Interpreter tab.

Edit spark interpreter

Change the master parameter

master yarn-client

Add 2 properties

spark.driver.extraJavaOptions -Dhdp.version=2.3.4.0-3485
spark.yarn.am.extraJavaOptions -Dhdp.version=2.3.4.0-3485

The bare minimum is now reached. How to get control over the Spark ports is described here.

Hive

Edit default.url parameter under Hive interpreter

default.url jdbc:hive2://hiveserver2:10000

Add 3 properties to hive interpreter

hive.hiveserver2.password hive
hive.hiveserver2.url jdbc:hive2://hiveserver2:10000
hive.hiveserver2.user hive

Testing Zeppelin

Create new Notebook and test it.

Scala

zeppelin scala test

SparkSQL

zeppelin sparkSQL test

Hive

zeppelin Hive test

PySpark

zeppelin pyspark test

Networking in Spark: Configuring ports in Spark

For Spark Context to run, some ports are used. Most of them are randomly chosen which makes it difficult to control them. This post describes how I am controlling Spark’s ports.

In my clusters, some nodes are dedicated client nodes, which means the users can access them, they can store files under their respective home directory (defining home on an attached volume is described here), and run jobs on it.

The Spark jobs can be run in different ways, from different interfaces – Command Line Interface, Zeppelin, RStudio…


Links to Spark installation and configuration

Installing Apache Spark 1.6.0 on a multinode cluster

Building Apache Zeppelin 0.6.0 on Spark 1.5.2 in a cluster mode

Building Zeppelin-With-R on Spark and Zeppelin

What Spark Documentation says

Spark UI

Spark User Interface, which shows application’s dashboard, has the default port of 4040 (link). Property name is

spark.ui.port

When submitting a new Spark Context, 4040 is attempted to be used. If this port is taken, 4041 will be tried, if this one is taken, 4042 is tried and so on, until an available port is found (or maximum attempts are met).
If the attempt is unsuccessful, the log is going to display a WARN and attempt the next port. Example follows:

WARN Utils: Service ‘SparkUI’ could not bind on port 4040. Attempting port 4041.
INFO Utils: Successfully started service ‘SparkUI’ on port 4041.
INFO SparkUI: Started SparkUI at http://client-server:4041

According to the log, the Spark UI is now listening on port 4041.

Not much randomizing for this port. This is not the case for ports in the next chapter.


Networking

Looking at the documentation about Networking in Spark 1.6.x, this post is focusing on the 6 properties that have default value random in the following picture:

spark networking.JPG

When Spark Context is in the process of creation these receive random values.

spark.blockManager.port
spark.broadcast.port
spark.driver.port
spark.executor.port
spark.fileserver.port
spark.replClassServer.port

These are the properties that should be controlled. They can be controlled in different ways, depending on how the job is run.


Scenarios and solutions

If you do not care about the values assigned to these properties then no further steps are needed..

Configuring ports in spark-defaults.conf

If you are running one Spark application per node (for example: submitting python scripts by using spark-submit), you might want to define the properties in the $SPARK_HOME/conf/spark-defaults.conf. Below is an example of what should be added to the configuration file.

spark.blockManager.port 38000
spark.broadcast.port 38001
spark.driver.port 38002
spark.executor.port 38003
spark.fileserver.port 38004
spark.replClassServer.port 38005

If a test is run, for example spark-submit test.py, the Spark UI is by default 4040 and the above mentioned ports are used.

Running the following command

sudo netstat -tulpn | grep 3800

Returns the following output:

tcp6      0      0      :::38000                          :::*      LISTEN      25300/java
tcp6      0      0      10.0.173.225:38002     :::*      LISTEN      25300/java
tcp6      0      0      10.0.173.225:38003     :::*      LISTEN      25300/java
tcp6      0      0      :::38004                          :::*      LISTEN      25300/java
tcp6      0      0      :::38005                          :::*      LISTEN      25300/java


Configuring ports directly in a script

In my case, different users would like to use different ways to run Spark applications. Here is an example of how ports are configured through a python script.

"""Pi-estimation.py"""

from random import randint
from pyspark.context import SparkContext
from pyspark.conf import SparkConf

def sample(p):
x, y = randint(0,1), randint(0,1)
print(x)
print(y)
return 1 if x*x + y*y < 1 else 0

conf = SparkConf()
conf.setMaster("yarn-client")
conf.setAppName("Pi")

conf.set("spark.ui.port", "4042")

conf.set("spark.blockManager.port", "38020")
conf.set("spark.broadcast.port", "38021")
conf.set("spark.driver.port", "38022")
conf.set("spark.executor.port", "38023")
conf.set("spark.fileserver.port", "38024")
conf.set("spark.replClassServer.port", "38025")

conf.set("spark.driver.memory", "4g")
conf.set("spark.executor.memory", "4g")

sc = SparkContext(conf=conf)

NUM_SAMPLES = randint(5000000, 100000000)
count = sc.parallelize(xrange(0, NUM_SAMPLES)).map(sample) \
.reduce(lambda a, b: a + b)
print("NUM_SAMPLES is %i" % NUM_SAMPLES)
print "Pi is roughly %f" % (4.0 * count / NUM_SAMPLES)
(The above Pi estimation is a Spark example that comes with Spark installation)

The property values in the script run over the properties in the spark-defaults.conf file. For the runtime of this script port 4042 and ports 38020-38025 are used.

If netstat command is run again for all ports that start with 380

sudo netstat -tulpn | grep 380

The following output is shown:

tcp6           0           0           :::38000                              :::*          LISTEN          25300/java
tcp6           0           0           10.0.173.225:38002         :::*          LISTEN          25300/java
tcp6           0           0           10.0.173.225:38003         :::*          LISTEN          25300/java
tcp6           0           0           :::38004                              :::*          LISTEN          25300/java
tcp6           0           0           :::38005                              :::*          LISTEN          25300/java
tcp6           0           0           :::38020                              :::*          LISTEN          27280/java
tcp6           0           0           10.0.173.225:38022         :::*          LISTEN          27280/java
tcp6           0           0           10.0.173.225:38023         :::*          LISTEN          27280/java
tcp6           0           0           :::38024                              :::*          LISTEN          27280/java

2 processes are running one separate Spark application each on ports that were defined beforehand.


Configuring ports in Zeppelin

Since my users use Apache Zeppelin, similar network management had to be done there. Zeppelin is also sending jobs to Spark Context through spark-submit command. That means that the properties can be configured in the same way. This time through an interpreter in Zeppelin:

Choosing menu Interpreter and choosing spark interpreter will get you there. Now it is all about adding new properties and respective values. Do not forget to click on the plus when you are ready to add a new property.
At the very end, save everything and restart the spark interpreter.

Below is an example of how this is done:

spark zeppelin ports

Next time a Spark context is created in Zeppelin, the ports will be taken into account.


Conclusion

This can be useful if multiple users are running Spark applications on one machine and have separate Spark Contexts.

In case of Zeppelin, this comes in handy when one Zeppelin instance is deployed per user.


Configuring home directory on client nodes

My cluster has dedicated nodes that take a role of a client. Users can connect to these clients with their own private keys and they have their own home directory.
Until now, the home directory was the default /home/username. Lately, Ambari has been warning me that client nodes are running out of disk.
I have added one volume to the client node and configured a new home for the users. How I am attaching volume to an instance is described here.

The new volume is mounted to folder /user. I am trying to imitate Hadoop’s filesystem. Since some users already exist and have their home directories under /home, I have to take care of them first.


Create /user folder

Create the folder where users’ home will reside

sudo mkdir /user

Move existing user

Moving existing user to a new home directory:

sudo usermod -m -d /user/test1 test1

If the new directory does not exist yet, usermod is going to create it.

After the command is finished, the directory /home/test1 is not available anymore and folder /user/test1 has become the new home directory for user1.

Explaining options*:

-m     move contents of the home directory to the new location (use only with -d)
-d       new home directory for the user account

*-taken from usermod man.

Now we can check some details of the user with the following command:

finger test1

The following output is given:

Login: test1 Name:
Directory: /user/test1 Shell: /bin/bash
Never logged in.
No mail.
No Plan.

Note:
If you run the usermod command on a user that is logged in, usermod is going to report an error:

usermod: user user2 is currently used by process 13995

Running ps aux on this process

ps aux | grep 13995

Reveals that the user user2 is logged in:

user2    13995  0.0  0.0 103568  2468 ?        S    11:59   0:00 sshd: user2@pts/2


Changing configuration for new users

Opening adduser.conf file

sudo vi /etc/adduser.conf

and changing (first uncommenting if needed!) the value for parameter DHOME does the trick:

DHOME=/user

Upon creation of a new user

sudo adduser newuser

this new user now has a new home directory on the attached volume. When logging in as newuser and running command pwd, the output is

/user/newuser

 
The existing users’ directories have now been moved to /user which is a dedicated volume for user files. The configuration file /etc/adduser.conf has been altered so that the new users are automatically defined as having home directory under /user.


Basic python example how REST API works

Application Programming Interface

REpresentational State Transfer

REST is a “software architectural style” of the WWW. REST API communicates between a client and a server through HTTP (most common, but not always!) by using the same verbs (GET, POST, PUT, DELETE) that web browsers use to retrieve web pages and send data (Wikipedia).


The results can be returned in many different file formats, where JSON is the most common one. The following examples return the results in JSON format.


Facebook example

Let us see how Facebook REST API (Facebook Graph API) works:

In a browser, the Facebook page of The University of St. Gallen loads as usual:

https://www.facebook.com/HSGUniStGallen

If “www” is replaced by “graph” and the following URL is loaded:

https://graph.facebook.com/HSGUniStGallen

The first result in a JSON format is returned:

{
  "error": {
    "message": "An access token is required to request this resource.",
    "type": "OAuthException",
    "code": 104,
    "fbtrace_id": "GhoWNOCPeFx"
  }
}

The reason for that is sometime at the beginning of 2015, Facebook has made its policies more strict whne it comes to who can access what. Now, an access token is needed. Running the following from the browser should return a JSON file with some data.

https://graph.facebook.com/HSGUniStGallen?access_token=ose0cBAMc4OZCs4w508tpKbu0ikeTNrZAyBY4Ipkj2phzXkq5cf2VZAngySd9lq5KWIq5sl1ZBo0iaIIvpTiyXcnM1YavhzqEh8cYnVPxn3ZC9y1ZB6xAgJYZCNiFfLFobOZAi0yAmyPEXoSIRXAF2yQluoZBbDB0C6e4yhgHg1CC9RwkoLQbaIJXypVdFylTbANfV1bgZDZD

Access token is invalid. Try with your own.

The result is the following:

{
“id”: “118336184931317”,
“about”: “Herzlich willkommen auf der offiziellen Facebook-Seite der Universit\u00e4t St.Gallen (HSG). // Welcome to the official University of St.Gallen (HSG) Facebook page.”,
“can_post”: false,
“category”: “University”,
“category_list”: [
{
“id”: “108051929285833”,
“name”: “College & University”
},
{
“id”: “216161991738736”,
“name”: “Campus Building”
}
],
“checkins”: 8596,
“cover”: {
“cover_id”: “233550823409852”,
“offset_x”: 0,
“offset_y”: 0,
“source”: “https://scontent.xx.fbcdn.net/v/t1.0-9/s720x720/404165_233550823409852_1060305907_n.jpg?oh=a6150b98691c08457fe200c9f0ad8765&oe=57AC6C2C&#8221;,
“id”: “233550823409852”
},
“description”: “Hier informieren wir Sie \u00fcber Neuigkeiten aus der Universit\u00e4t sowie aus den HSG-Themenhubs START, CAMPUS, PROFESSIONAL und RESEARCH. Maria Schmeiser \u003Cms> schreibt hier f\u00fcr Sie.\n\nHSG START bietet Informationen f\u00fcr Studieninteressierte u. a. \u00fcber Themen wie Informationstage, Messen, Zulassung und Anmeldung und Weiterbildung. https://www.facebook.com/HSGStart\n\nHSG CAMPUS b\u00fcndelt Informationen zu Studierenden-Themen aus der Studentenschaft, Bibliothek, Sport und Karrierethemen. Dar\u00fcberhinaus informiert HSG CAMPUS \u00fcber das Campus-Leben in St.Gallen. https://www.facebook.com/HSGCampus\n\nHSG RESEARCH b\u00fcndelt Informationen aus der Universit\u00e4t f\u00fcr Forschende und Forschungsinteressierte. https://www.facebook.com/HSGResearch\n\nHSG PROFESSIONAL informiert \u00fcber \u00d6ffentlichkeits-, Medien- und Alumni-Themen sowie Stellenangebote der Universit\u00e4t St.Gallen (HSG). https://www.facebook.com/HSGProfessional\n\n____________________________________\n\nHere you\u2019ll find information about the university as well our specialist hubs: START, CAMPUS, PROFESSIONAL and RESEARCH. Maria Schmeiser \u003Cms> writes for you here.\n\nHSG START gives you a head start on subjects such as open days, fairs, entry requirement and our courses if you’re interested in studying at the University of St.Gallen (HSG). https://www.facebook.com/HSGStart\n\nHSG CAMPUS curates information from around the University, such as the student union, the library, sports and careers, as well as documenting life at the University of St.Gallen (HSG). https://www.facebook.com/HSGCampus\n\nHSG RESEARCH curates information from around the University concerning research projects. https://www.facebook.com/HSGResearch\n\nHSG PROFESSIONAL curates information from around the University such as media, press and Alumni as well as informing you about current career opportunities at the University. https://www.facebook.com/HSGProfessional&#8221;,
“founded”: “1898”,
“general_info”: “Die Universit\u00e4t St.Gallen (HSG) wurde 1898 \u2013 in der Hochbl\u00fcte der St.Galler Stickereiindustrie \u2013 als Handelsakademie gegr\u00fcndet und ist heute eine Hochschule f\u00fcr Wirtschafts-, Rechts- und Sozialwissenschaften sowie Internationale Beziehungen. 1899 fanden die ersten Vorlesungen statt. Praxisn\u00e4he und eine integrative Sicht zeichnen unsere Ausbildung seit jenen Gr\u00fcndungstagen aus. Wir geh\u00f6ren wir zu den f\u00fchrenden Wirtschaftsuniversit\u00e4ten in Europa und sind EQUIS- und AACSB-akkreditiert.\n\nIm Jahr 2001 haben wir Bachelor- und Master-Studieng\u00e4nge integral eingef\u00fchrt und gleichzeitig unsere Ausbildung tiefgreifend reformiert. Seither steht nicht mehr nur die Fachausbildung im Vordergrund, sondern auch die Pers\u00f6nlichkeitsbildung. Bei uns k\u00f6nnen Abschl\u00fcsse auf Bachelor-, Master- und Doktorats/ Ph.D.-Stufe erreicht werden. Die enge Vernetzung von Studium, Weiterbildung und Forschung ist uns wichtig.\n\n____________________________________\n\nThe University of St.Gallen (HSG) was founded as a business academy in 1898 \u2013 in the heyday of the St.Gallen embroidery industry and is nowadays a School of Management, Economics, Law, Social Sciences and International Affairs. The first lectures were held in 1899. The practice-oriented approach and integrative view have characterised the education we offer since those early days. Today, we are one of Europe\u2019s leading business schools and are EQUIS and AACSB accredited.\n\nIn 2001, we introduced Bachelor\u2019s and Master\u2019s degree courses across the board and fundamentally reformed the education we offer. Since then, we no longer focus just on professional training but also on character building. At our university, you can complete studies at Bachelor\u2019s, Master\u2019s and Ph.D. level. The close integration of studies, further education and research is important to us.”,
“has_added_app”: false,
“is_community_page”: false,
“is_published”: true,
“likes”: 20791,
“link”: “https://www.facebook.com/HSGUniStGallen/&#8221;,
“location”: {
“city”: “Saint Gallen”,
“country”: “Switzerland”,
“latitude”: 47.431544844559,
“longitude”: 9.3751522771065,
“street”: “Dufourstrasse 50”,
“zip”: “9000”
},
“name”: “Universit\u00e4t St.Gallen (HSG)”,
“parking”: {
“lot”: 0,
“street”: 0,
“valet”: 0
},
“phone”: “+41 (0)71 224 21 11”,
“talking_about_count”: 455,
“username”: “HSGUniStGallen”,
“website”: “www.unisg.ch”,
“were_here_count”: 8596
}

Only selected values (name, likes, street and zip) can be fetched:

https://graph.facebook.com/HSGUniStGallen?fields=name,likes,location.street,location.zip&access_token=ose0cBAMc4OZCs4w508tpKbu0ikeTNrZAyBY4Ipkj2phzXkq5cf2VZAngySd9lq5KWIq5sl1ZBo0iaIIvpTiyXcnM1YavhzqEh8cYnVPxn3ZC9y1ZB6xAgJYZCNiFfLFobOZAi0yAmyPEXoSIRXAF2yQluoZBbDB0C6e4yhgHg1CC9RwkoLQbaIJXypVdFylTbANfV1bgZDZD

This is what is returned:

{
  "name": "Universit\u00e4t St.Gallen (HSG)",
  "likes": 20791,
  "location": {
  "street": "Dufourstrasse 50",
  "zip": "9000"
},
  "id": "118336184931317"
}

These calls can be triggered from a piece of code as well. Here is how it is done in Python. JSON object is parsed and name, number of likes, street address and postal code are returned.

#!/usr/bin/env python

import urllib2
import json

facebook_token = 'ose0cBAMc4OZCs4w508tpKbu0ikeTNrZAyBY4Ipkj2phzXkq5cf2VZAngySd9lq5KWIq5sl1ZBo0iaIIvpTiyXcnM1YavhzqEh8cYnVPxn3ZC9y1ZB6xAgJYZCNiFfLFobOZAi0yAmyPEXoSIRXAF2yQluoZBbDB0C6e4yhgHg1CC9RwkoLQbaIJXypVdFylTbANfV1bgZDZD'

#fetch name, likes, street and postal code
url = 'https://graph.facebook.com/HSGUniStGallen?fields=name,likes,location.street,location.zip&access_token=' + facebook_token

json_str = urllib2.urlopen(url)
fdata = json.load(json_str)

print 'Name: ' + str(fdata['name'].encode('utf-8'))
print 'Address: ' + str(fdata['location']['street']) + ', ' + str(fdata['location']['zip'])
print 'Likes: ' + str(fdata['likes'])

The output of the code is the following:

Name: Universität St.Gallen (HSG)
Address: Dufourstrasse 50, 9000
Likes: 20792

A lot more user friendly to read than JSON.


REST API and Hadoop administration

Administrating Hadoop from Ambari sometimes requires running REST API commands. Here is an example of how to remove a service from the cluster by using ambari REST API:

curl -u admin:admin -H “X-Requested-By: ambari” -X DELETE http://ambari-server:8080/api/v1/clusters/testiwimd/services/MAPREDUCE2/components/HISTORYSERVER


Removing Datanode(s) from a cluster with Ambari

Datanodes come and go.
Proper removal of a Datanode is important, otherwise you might end up with missing blocks or unconsolidated Ambari meta database.
In this post, I am removing 2 Datanodes from my cluster. Before doing this, I have to know the replication factor (3 in my case) and the number of Datanodes left after the decommission. This is important because of the following rule:

If replication factor is higher than the number of existing datanodes after the removal, the removal process is not going to succeed!

In my case, I have 5 datanodes in the cluster, so I am going to be left with 3 Datanodes after removing 2.

Following procedure is needed to remove Datanode(s) properly:

  1. From the Hosts list, check the Datanodes you wish to remove.
  2. Decommission Nodemanagers
    decomission nodemanager
  3. Decommision Datanodesdecommission datanode
  4. Stop Ambari Metrics on each Datanode
    ambari metrics stop
  5. While on the same page, stop all components
    stop all components
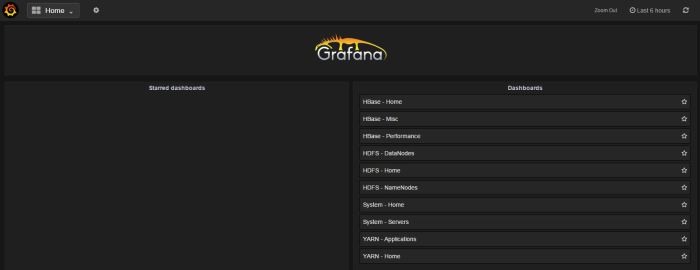
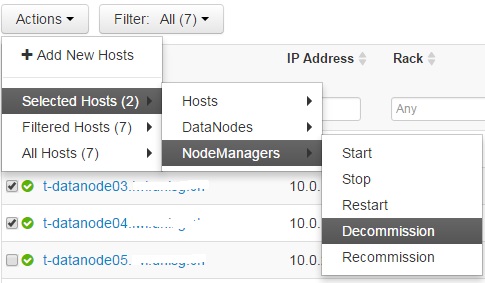
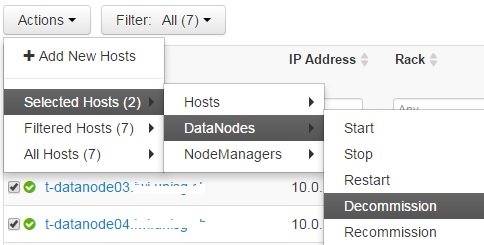
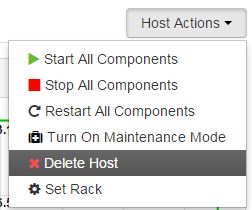
Repeat this for every Datanode.Click OK on the confirmation window.
    stop all components confirmation
    Background Operations window informs you when the components are stopped.
    status report
  6. Stop the Ambari Agent.
    Log in to each to-be-removed Datanode and stop the Ambari Agent.

    sudo ambari-agent stop
  7. Delete Host
    While on the same page, from the Host Actions menu, choose Delete Host
    delete host
    Repeat this for every Datanode.
  8. Restart HDFS and YARN services from Ambari.
    The soon to be removed Datanode(s) are in decommissioned status and will remain in it until HDFS service is restarted. Ambari reminds you to restart HDFS and YARN.HDFS status

The unwanted Datanodes have now been removed. I have a cluster with 3 Datanodes after removing 2.

Corrupted blocks in HDFS

Ambari on one of my test environments was warning me about under replicated blocks in the cluster:

ambari - under replicated blocks

Opening the Namenode web UI (http://test01.namenode1:50070/dfshealth.html#tab-overview) painted a different picture:

namenode web ui - overview information about blocks

11 blocks are missing which might lead to corrupted files in the cluster.

Running file check on one of the files:

sudo -u hdfs hdfs fsck /tmp/tony/adac.json

The output:

fsck - corrupted file

The output reveals that the file is corrupted, was split in 4 blocks and is replicated only once on the cluster.

Nothing to do but to permanenetly delete the file:

sudo -u hdfs hdfs dfs -rm -skipTrash /tmp/tony/adac.json

Ambari wil now show 4 blocks less in the Under Replicated Blocks widget. Refreshing the Namenode web UI will also show that the corrupted blocks are removed.